
Welcome to the wild, wonderful, and slightly confusing world of data types! Whether you’re a seasoned data analyst or someone just trying to figure out why your coffee machine can’t understand your complex order, understanding data types is crucial. Don’t worry, though! We’re going to break down these categories in a way that’s so fun, you’ll want to tell all your friends about it at the next party. Grab your magnifying glass—it’s time to explore nominal, ordinal, interval, ratio, and a little extra twist: discrete vs. continuous. Ready? Let’s go!
1. Nominal Data: The Label Party
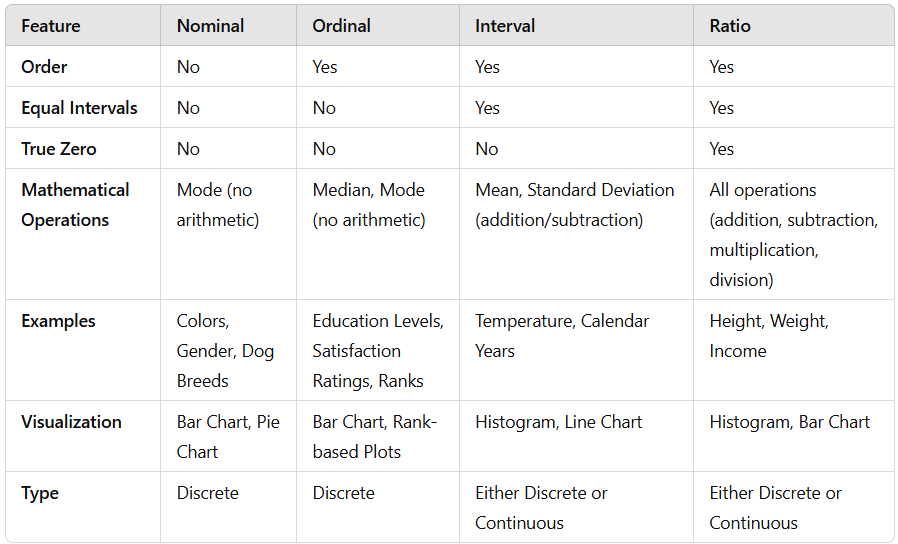
Imagine you’re at a party where everyone is wearing name tags. You see someone with a “Cactus Enthusiast” name tag, another one with “World’s Best Napper,” and someone else with “Certified Pizza Lover.” That’s nominal data: names, labels, and categories that don’t have any particular order.
Examples:
- Favorite Pizza Topping: Pepperoni, Mushroom, Pineapple (you monster)
- Hair Color: Blonde, Brunette, Redhead, Bald (hey, no judgment)
- Dog Breeds: Poodle, Bulldog, Shiba Inu (the cool dog)
Here, you can count how many people are wearing certain name tags (mode) or ask, “Which group has the most pizza lovers?” But don’t even think about adding these categories together. That would be like trying to add “Blonde” + “Mushroom.” Doesn’t quite work, right?
2. Ordinal Data: The “Not-So-Equal” Rankings
Now, let’s move to ordinal data, where we actually get rankings. But there’s a catch—while we can order the data, we have no idea if the difference between each ranking is the same. It’s like giving a school report card: Sure, an “A” is better than a “B,” but is an “A” worth two “B”s? Hard to say.
Examples:
- Movie Ratings: Poor, Fair, Good, Great, Excellent (Is a 9/10 really that different from an 8/10?)
- T-shirt Sizes: Small, Medium, Large, Extra Large (No, Large is not a “double medium”)
- Hunger Levels: Starving, Hungry, Satisfied, Full (Who’s “Starving” at 3 PM, anyway?)
While you can rank these from worst to best (or smallest to biggest), don’t try to calculate things like averages or ratios here. What’s the difference between “Hungry” and “Starving”? We’re not sure. But it’s definitely not mathematical.
3. Interval Data: The “Almost Accurate” Data
Interval data is where things get a little more scientific. Now we’re talking about data that has meaningful intervals, like the space between temperatures on a thermometer. But wait—there’s a twist! These numbers don’t have a true zero. So, for instance, 20°C isn’t “twice as warm” as 10°C—because zero degrees Celsius doesn’t mean “no temperature.”
Examples:
- Temperature: 20°C, 30°C, 40°C (but no such thing as “zero hot”)
- Calendar Dates: 1990, 2000, 2010 (you can’t say 2000 is “twice as far” from 1990)
- Time of Day: 2 PM, 3 PM, 4 PM (It’s all about that clock game)
Interval data allows for addition and subtraction—because the space between, say, 20°C and 30°C is the same as the space between 30°C and 40°C—but multiplication and division? That’s a no-go.
4. Ratio Data: The Overachiever of Data Types
And finally, meet ratio data—the overachiever who shows up with all the tools and knows how to use them. This data has it all: it has meaningful intervals and a true zero. A true zero means that zero actually means something, like “no weight,” “no height,” or “no money.” Now, ratios like “twice as much” make perfect sense.
Examples:
- Weight: 0 kg, 5 kg, 10 kg (Zero means no weight at all—how refreshing!)
- Height: 0 cm, 150 cm, 180 cm (Zero is real here—think of the world’s shortest person)
- Income: $0, $1000, $5000 (Zero means absolutely no money—ouch)
With ratio data, you can perform all the math: addition, subtraction, multiplication, division—you name it. It’s like the data version of a Swiss Army knife.
Discrete vs. Continuous Data: The Tale of Two Data Worlds
But wait—there’s more! Data types don’t just come in four flavors; they also exist in two categories: discrete and continuous. This is where the true chaos unfolds!
i. Discrete Data:
Think of it like a jar of jellybeans—countable, whole numbers, and no fractions allowed. If you’re counting the number of students in a class, you can’t have 3.5 students (unless you’ve discovered some very bizarre physics).
Examples:
- Number of books on a shelf: 5, 6, 7 (no half-books!)
- Number of pets in a house: 1, 2, 3 (no “two and a half cats”)
ii. Continuous Data:
Ah, here we enter the world of smooth, flowing numbers that never seem to stop. It’s like the ocean—just keep counting the waves.
Examples:
- Height: 5.5 feet, 5.75 feet, 5.77 feet (the decimals keep coming)
- Weight: 130.3 lbs, 130.35 lbs (I told you, decimals galore)
- Time: 12.01 PM, 12.001 PM, 12.0001 PM (yep, more decimals!)
Continuous data can take any value in a range, meaning it can get as granular as you need. Pretty neat, right?

Why It Matters: Why You Should Care
Now that we’ve gone through the wacky world of data types, why does it all matter? Simple: knowing whether your data is nominal, ordinal, interval, or ratio (and discrete or continuous) helps you pick the right math tools for the job. Don’t try to average your favorite pizza toppings—stick to counting them. And don’t try to multiply temperatures—just enjoy the weather.
So, next time you’re staring at a bunch of data, ask yourself: “Is this nominal, ordinal, interval, or ratio? And is it discrete or continuous?” With this knowledge, you’ll never have to worry about adding apples to oranges—or calculating the square root of pineapple pizza.
Stay nerdy, my friends!
