

In the world of data visualization, raw data is just the beginning. The real power comes from transforming that data into something meaningful—and in Grafieks, that transformation starts with custom fields.
Whether you’re tracking sales performance, analyzing website traffic, or measuring employee productivity, Grafieks custom fields help you go beyond what’s available in your dataset to uncover deeper insights.
What Are Custom Fields in Grafieks?
Custom fields, also called calculated fields, are user-defined columns created by applying formulas or logic to existing fields in your dataset. They allow you to derive new values that aren’t present in your source data but are critical for analysis.
Example:
If your dataset has Sales and Cost, you can create a custom field:Profit = Sales - Cost
You can also build more complex logic like:IF Sales > 1000 THEN "High Performer" ELSE "Low Performer"
Why custom fields matter in Grafieks dashboards
Raw data alone often lacks the structure and clarity needed for impactful data storytelling. Custom fields bridge that gap by:
- 🧠 Creating New Metrics — Calculate KPIs like profit margin, average deal size, or retention rate.
- 🏷️ Categorizing Data — Group customers into tiers, products into price ranges, or employees into performance bands.
- 🧩 Powering Dynamic Dashboards — Custom fields adapt and update with filters or time ranges, keeping your visualizations relevant and up-to-date.
“Without custom fields, dashboards are just static reports. With them, Grafieks becomes a real-time analytics engine.”
Real-world use cases
Here’s how different teams leverage Grafieks custom fields to turn raw numbers into strategic insight:
a. Sales Team
- Calculate
Conversion Rate = Deals Closed / Leads Contacted - Flag high-value deals with conditional logic
- Segment reps by performance levels
b. Marketing Team
- Track ROI:
(Revenue - Ad Spend) / Ad Spend - Create campaign classifications like “Low Cost, High Return”
c. HR or People Analytics
- Group employees by tenure:
IF Tenure > 5 THEN 'Veteran' ELSE 'Newcomer' - Create a custom turnover risk score
How to create a custom field in Grafieks (Quick Overview)
- Navigate to your catalog explorer from the data source menu in Grafieks.
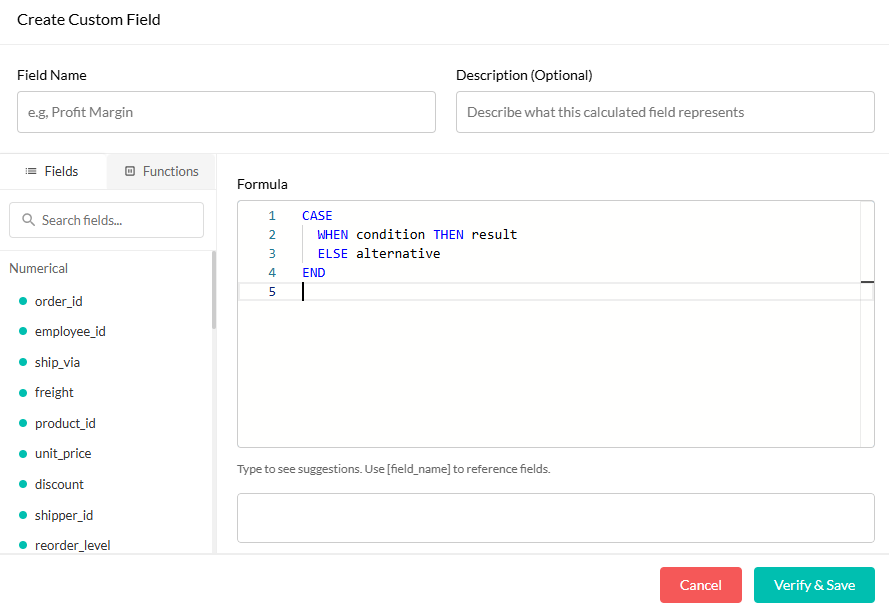
- Click “Add Custom Field” and use the formula editor.
- Enter your expression (e.g.,
Revenue - Cost). - Save, name it clearly (e.g., “Net Profit”), and apply it to your visuals.
✔️ Tip: Always test your logic with filters to ensure accuracy.
Final Thoughts: Don’t just visualize – Analyze
Custom fields in Grafieks are more than just a convenience – they’re a strategic advantage. By transforming raw data into calculated insights, you empower your dashboards to do more than report – you enable them to guide decisions.
Whether you’re a business analyst, marketer, or product manager, mastering custom fields will turn Grafieks into your most valuable business intelligence tool.
Start refining your dashboards today.
Explore Grafieks custom fields and unlock the real story behind your data.
